Logging with ELK stack
Logging with ELK stack
In this how to tutorial, we will get a brief intro to Elasticsearch, Kibana and Logstash and how we can use them for storing and filtering logs that our applications produce. At the end, we will also go through how we can run the ELK stack in docker.
Elasticsearch
Elasticsearch is a platform for distributed search and analysis of data in real time. It is a popular choice due to its usability, powerful features, and scalability. In this article, we will learn about some of the use cases of elasticsearch and the elastic-stack in general.
Elasticsearch uses various types of indexes based on type of data. This results in very fast data access.
Follow https://www.elastic.co/guide/en/elasticsearch/reference/current/setup.html to install elasticsearch.
Note: When you install elasticsearch and it runs for the first time, it automatically configures security and generates:
- Certificates and keys
- Password for elastic user
- Enrollment token for kibana
Copy them and keep them in a secure location. We will need them later.
If you were unable to copy them, its fine, we see how to generate a new one.
Logstash
Logstash is a data collection engine in the elastic stack that can be used to collect, transform and store(in elasticsearch) data that our applications generate.
Follow https://www.elastic.co/guide/en/logstash/current/setup-logstash.html to install logstash on your system.
To get started we need to make a logstash.conf file. This file consists of:
-
Input
This section of the logstash.conf file is responsible for getting our logs. We can either use a library to send our application logs to elasticsearch or we can go the much easier way and just log data to a file as we normally do, and use logstash to read from it.
Logstash has input plugins which enables a specific source of events to be read by Logstash.
We can also use codecs for transforming our data to a particular format. eg. reading csv data.
Codecs are responsible for decoding data from inputs and encoding data for output. -
Filter
Filtering is often essential for making sense of our data. We can use filtering for formatting our data so it becomes much easier to index.
A filter plugin performs intermediary processing on an event. Filters are often applied conditionally depending on the characteristics of the event. -
Output
Output section, as the name suggests is responsible for outputting our data to our desired location.
An output plugin sends event data to a particular destination. Outputs are the final stage in the event pipeline.
In our use case, we are going to use the elasticsearch plugin.
For this plugin, we can specify an elasticsearch index to which our log data will be added.
The .conf file we built is a pipeline. We can build several pipelines like this. When we deploy logstash on a server, we can give this pipeline config file to logstash.yml.
In order to use multiple pipeline configs, we have to configure 'pipeline.yml' file.
To get a more comprehensive explanation of configuration, see https://www.elastic.co/guide/en/logstash/current/configuration-file-structure.html
Kibana
Kibana is a tool for accessing and viewing data accumulated and aggregated by elasticstack.
We can use kibana to filter and view data stored in elasticsearch.
Follow https://www.elastic.co/guide/en/kibana/current/install.html to setup kibana.
Once kibana is installed, run it. It will generate a unique link on the terminal. Opening it opens a page where we can input the enrollment token that was generated when first starting elasticsearch. Afterwards, enter the password generated for elastic user.
Installing ELK stack in docker
If your application already runs inside docker container, add the following docker-compose.yml into the already existing docker-compose.yml, else, create a new docker-compose.yml.
We are going to run our ELK stack inside a docker container.
We will have to do some setup before that.
Following is the directory structure we will have.
.
├── docker-compose.yml
├── elasticsearch
│   ├── config
│   │   └── elasticsearch.yml
│   ├── Dockerfile
│   └── .dockerignore
├── .env
├── kibana
│   ├── config
│   │   └── kibana.yml
│   ├── Dockerfile
│   └── .dockerignore
├── logstash
│   ├── config
│   │   └── logstash.yml
│   ├── Dockerfile
│   ├── .dockerignore
│   └── pipeline
│       └── logstash.conf
└── setup
    ├── Dockerfile
    ├── .dockerignore
    ├── entrypoint.sh
    ├── .gitignore
    ├── lib.sh
    └── roles
        └── logstash_writer.json
The following files can be added to your project as is.
docker-compose.yml
version: '3.7'

services:

  # The 'setup' service runs a one-off script which initializes users inside
  # Elasticsearch — such as 'logstash_internal' and 'kibana_system' — with the
  # values of the passwords defined in the '.env' file.
  #
  # This task is only performed during the *initial* startup of the stack. On all
  # subsequent runs, the service simply returns immediately, without performing
  # any modification to existing users.
  setup:
    build:
      context: setup/
      args:
        ELASTIC_VERSION: ${ELASTIC_VERSION}
    init: true
    volumes:
      - ./setup/entrypoint.sh:/entrypoint.sh:ro,Z
      - ./setup/lib.sh:/lib.sh:ro,Z
      - ./setup/roles:/roles:ro,Z
      - setup:/state:Z
    environment:
      ELASTIC_PASSWORD: ${ELASTIC_PASSWORD:-}
      LOGSTASH_INTERNAL_PASSWORD: ${LOGSTASH_INTERNAL_PASSWORD:-}
      KIBANA_SYSTEM_PASSWORD: ${KIBANA_SYSTEM_PASSWORD:-}
    networks:
      - elk
    depends_on:
      - elasticsearch

  elasticsearch:
    # image: docker.elastic.co/kibana/kibana:${ELASTIC_VERSION}
    build:
      context: elasticsearch/
      args:
        ELASTIC_VERSION: ${ELASTIC_VERSION}
    volumes:
      - ./elasticsearch/config/elasticsearch.yml:/usr/share/elasticsearch/config/elasticsearch.yml:ro,Z
      - elasticsearch:/usr/share/elasticsearch/data:Z
    ports:
      - 9200:9200
      - 9300:9300
    environment:
      node.name: elasticsearch
      ES_JAVA_OPTS: -Xms512m -Xmx512m
      # Bootstrap password.
      # Used to initialize the keystore during the initial startup of
      # Elasticsearch. Ignored on subsequent runs.
      ELASTIC_PASSWORD: ${ELASTIC_PASSWORD:-}
      # Use single node discovery in order to disable production mode and avoid bootstrap checks.
      # see: https://www.elastic.co/guide/en/elasticsearch/reference/current/bootstrap-checks.html
      discovery.type: single-node
    networks:
      - elk
    restart: unless-stopped

  logstash:
    # image: docker.elastic.co/logstash/logstash:${ELASTIC_VERSION}
    build:
      context: logstash/
      args:
        ELASTIC_VERSION: ${ELASTIC_VERSION}
    volumes:
      - ./logstash/config/logstash.yml:/usr/share/logstash/config/logstash.yml:ro,Z
      - ./logstash/pipeline:/usr/share/logstash/pipeline:ro,Z
    ports:
      - 5044:5044
      - 50000:50000/tcp
      - 50000:50000/udp
      - 9600:9600
    environment:
      LS_JAVA_OPTS: -Xms256m -Xmx256m
      LOGSTASH_INTERNAL_PASSWORD: ${LOGSTASH_INTERNAL_PASSWORD:-}
    networks:
      - elk
    depends_on:
      - elasticsearch
    restart: unless-stopped

  kibana:
    # image: docker.elastic.co/kibana/kibana:${ELASTIC_VERSION}
    build:
      context: kibana/
      args:
        ELASTIC_VERSION: ${ELASTIC_VERSION}
    volumes:
      - ./kibana/config/kibana.yml:/usr/share/kibana/config/kibana.yml:ro,Z
    ports:
      - 5601:5601
    environment:
      KIBANA_SYSTEM_PASSWORD: ${KIBANA_SYSTEM_PASSWORD:-}
    networks:
      - elk
    depends_on:
      - elasticsearch
    restart: unless-stopped

networks:
  elk:
    driver: bridge

volumes:
  setup:
  elasticsearch:
Note: There are two ways of building a container.
- image:
In this method, docker downloads and loads the specified imae. This is a simple form of building an image and is useful if we want a single component.
- build:
In this method, we specify the Dockerfile that will be used to setup the container. This method is useful if we want to build a container with multiple images. In this example of docker-compose.yml, we might want to setup elasticsearch, kibana and logstash with their own plugins. For that, we use individual Dockerfiles.
.dockerignore
# Ignore Docker build files
Dockerfile
.dockerignore

# Ignore OS artifacts
**/.DS_Store

# Ignore Git files
.gitignore

# Ignore setup state
state/
elasticsearch/
elasticsearch.yml
## Default Elasticsearch configuration from Elasticsearch base image.
## https://github.com/elastic/elasticsearch/blob/main/distribution/docker/src/docker/config/elasticsearch.yml
#
cluster.name: docker-cluster
network.host: 0.0.0.0

## X-Pack settings
## see https://www.elastic.co/guide/en/elasticsearch/reference/current/security-settings.html
#
xpack.license.self_generated.type: trial
xpack.security.enabled: true
Dockerfile
ARG ELASTIC_VERSION

# https://www.docker.elastic.co/
FROM docker.elastic.co/elasticsearch/elasticsearch:${ELASTIC_VERSION}

# Add your elasticsearch plugins setup here
# Example: RUN elasticsearch-plugin install analysis-icu
kibana/
kibana.yml
---
## Default Kibana configuration from Kibana base image.
## https://github.com/elastic/kibana/blob/main/src/dev/build/tasks/os_packages/docker_generator/templates/kibana_yml.template.ts
#
server.name: kibana
server.host: 0.0.0.0
elasticsearch.hosts: [ http://elasticsearch:9200 ]

monitoring.ui.container.elasticsearch.enabled: true
monitoring.ui.container.logstash.enabled: true

## X-Pack security credentials
#
elasticsearch.username: kibana_system
elasticsearch.password: ${KIBANA_SYSTEM_PASSWORD}

## Encryption keys (optional but highly recommended)
##
## Generate with either
##  $ docker container run --rm docker.elastic.co/kibana/kibana:8.6.2 bin/kibana-encryption-keys generate
##  $ openssl rand -hex 32
##
## https://www.elastic.co/guide/en/kibana/current/using-kibana-with-security.html
## https://www.elastic.co/guide/en/kibana/current/kibana-encryption-keys.html
#
#xpack.security.encryptionKey:
#xpack.encryptedSavedObjects.encryptionKey:
#xpack.reporting.encryptionKey:

## Fleet
## https://www.elastic.co/guide/en/kibana/current/fleet-settings-kb.html
#
xpack.fleet.agents.fleet_server.hosts: [ http://fleet-server:8220 ]

xpack.fleet.outputs:
  - id: fleet-default-output
    name: default
    type: elasticsearch
    hosts: [ http://elasticsearch:9200 ]
    is_default: true
    is_default_monitoring: true

xpack.fleet.packages:
  - name: fleet_server
    version: latest
  - name: system
    version: latest
  - name: elastic_agent
    version: latest
  - name: apm
    version: latest

xpack.fleet.agentPolicies:
  - name: Fleet Server Policy
    id: fleet-server-policy
    description: Static agent policy for Fleet Server
    monitoring_enabled:
      - logs
      - metrics
    package_policies:
      - name: fleet_server-1
        package:
          name: fleet_server
      - name: system-1
        package:
          name: system
      - name: elastic_agent-1
        package:
          name: elastic_agent
  - name: Agent Policy APM Server
    id: agent-policy-apm-server
    description: Static agent policy for the APM Server integration
    monitoring_enabled:
      - logs
      - metrics
    package_policies:
      - name: system-1
        package:
          name: system
      - name: elastic_agent-1
        package:
          name: elastic_agent
      - name: apm-1
        package:
          name: apm
        # See the APM package manifest for a list of possible inputs.
        # https://github.com/elastic/apm-server/blob/v8.5.0/apmpackage/apm/manifest.yml#L41-L168
        inputs:
          - type: apm
            vars:
              - name: host
                value: 0.0.0.0:8200
              - name: url
                value: http://apm-server:8200
Dockerfile
ARG ELASTIC_VERSION

# https://www.docker.elastic.co/
FROM docker.elastic.co/kibana/kibana:${ELASTIC_VERSION}

# Add your kibana plugins setup here
# Example: RUN kibana-plugin install <name|url>
logstash/
logstash.yml
---
## Default Logstash configuration from Logstash base image.
## https://github.com/elastic/logstash/blob/main/docker/data/logstash/config/logstash-full.yml
#
http.host: 0.0.0.0

node.name: logstash
logstash.conf
input {
    tcp {
        port => 50000
    }
}

## Add your filters / logstash plugins configuration here

output {
    elasticsearch {
        hosts => "elasticsearch:9200"
        user => "logstash_internal"
        password => "${LOGSTASH_INTERNAL_PASSWORD}"
    }
}
Dockerfile
ARG ELASTIC_VERSION

# https://www.docker.elastic.co/
FROM docker.elastic.co/logstash/logstash:${ELASTIC_VERSION}

# Add your logstash plugins setup here
# Example: RUN logstash-plugin install logstash-filter-json
setup/
In this directory, we setup our elk stack and their plugins.
If we are to add more modules and plugins like filebeat etc., we need to add their passwords and role in this setup directory (in entrypoint.sh and add <module>_writer.json in roles directory).
entrypoint.sh
#!/usr/bin/env bash

set -eu
set -o pipefail

source "${BASH_SOURCE[0]%/*}"/lib.sh


# --------------------------------------------------------
# Users declarations

declare -A users_passwords
users_passwords=(
    [logstash_internal]="${LOGSTASH_INTERNAL_PASSWORD:-}"
    [kibana_system]="${KIBANA_SYSTEM_PASSWORD:-}"
    # add more elk passwords for filebeat, metricbeat etc
)

declare -A users_roles
users_roles=(
    [logstash_internal]='logstash_writer'
    # declare more writers like filebeat_writer etc.
)

# --------------------------------------------------------
# Roles declarations

declare -A roles_files
roles_files=(
    [logstash_writer]='logstash_writer.json'
    # declare more role files like filebeat_writer.json etc.
)

# --------------------------------------------------------


echo "-------- $(date --rfc-3339=seconds) --------"

state_file="${BASH_SOURCE[0]%/*}"/state/.done
if [[ -e "$state_file" ]]; then
    declare state_birthtime
    state_birthtime="$(stat -c '%Y' "$state_file")"
    state_birthtime="$(date --rfc-3339=seconds --date="@${state_birthtime}")"

    log "Setup has already run successfully on ${state_birthtime}. Skipping"
    exit 0
fi

log 'Waiting for availability of Elasticsearch. This can take several minutes.'

declare -i exit_code=0
wait_for_elasticsearch || exit_code=$?

if ((exit_code)); then
    case $exit_code in
        6)
            suberr 'Could not resolve host. Is Elasticsearch running?'
            ;;
        7)
            suberr 'Failed to connect to host. Is Elasticsearch healthy?'
            ;;
        28)
            suberr 'Timeout connecting to host. Is Elasticsearch healthy?'
            ;;
        *)
            suberr "Connection to Elasticsearch failed. Exit code: ${exit_code}"
            ;;
    esac

    exit $exit_code
fi

sublog 'Elasticsearch is running'

log 'Waiting for initialization of built-in users'

wait_for_builtin_users || exit_code=$?

if ((exit_code)); then
    suberr 'Timed out waiting for condition'
    exit $exit_code
fi

sublog 'Built-in users were initialized'

for role in "${!roles_files[@]}"; do
    log "Role '$role'"

    declare body_file
    body_file="${BASH_SOURCE[0]%/*}/roles/${roles_files[$role]:-}"
    if [[ ! -f "${body_file:-}" ]]; then
        sublog "No role body found at '${body_file}', skipping"
        continue
    fi

    sublog 'Creating/updating'
    ensure_role "$role" "$(<"${body_file}")"
done

for user in "${!users_passwords[@]}"; do
    log "User '$user'"
    if [[ -z "${users_passwords[$user]:-}" ]]; then
        sublog 'No password defined, skipping'
        continue
    fi

    declare -i user_exists=0
    user_exists="$(check_user_exists "$user")"

    if ((user_exists)); then
        sublog 'User exists, setting password'
        set_user_password "$user" "${users_passwords[$user]}"
    else
        if [[ -z "${users_roles[$user]:-}" ]]; then
            suberr '  No role defined, skipping creation'
            continue
        fi

        sublog 'User does not exist, creating'
        create_user "$user" "${users_passwords[$user]}" "${users_roles[$user]}"
    fi
done

mkdir -p "${state_file%/*}"
touch "$state_file"
lib.sh
#!/usr/bin/env bash

# Log a message.
function log {
    echo "[+] $1"
}

# Log a message at a sub-level.
function sublog {
    echo "   ⠿ $1"
}

# Log an error.
function err {
    echo "[x] $1" >&2
}

# Log an error at a sub-level.
function suberr {
    echo "   ⠍ $1" >&2
}

# Poll the 'elasticsearch' service until it responds with HTTP code 200.
function wait_for_elasticsearch {
    local elasticsearch_host="${ELASTICSEARCH_HOST:-elasticsearch}"

    local -a args=( '-s' '-D-' '-m15' '-w' '%{http_code}' "http://${elasticsearch_host}:9200/" )

    if [[ -n "${ELASTIC_PASSWORD:-}" ]]; then
        args+=( '-u' "elastic:${ELASTIC_PASSWORD}" )
    fi

    local -i result=1
    local output

    # retry for max 300s (60*5s)
    for _ in $(seq 1 60); do
        local -i exit_code=0
        output="$(curl "${args[@]}")" || exit_code=$?

        if ((exit_code)); then
            result=$exit_code
        fi

        if [[ "${output: -3}" -eq 200 ]]; then
            result=0
            break
        fi

        sleep 5
    done

    if ((result)) && [[ "${output: -3}" -ne 000 ]]; then
        echo -e "\n${output::-3}"
    fi

    return $result
}

# Poll the Elasticsearch users API until it returns users.
function wait_for_builtin_users {
    local elasticsearch_host="${ELASTICSEARCH_HOST:-elasticsearch}"

    local -a args=( '-s' '-D-' '-m15' "http://${elasticsearch_host}:9200/_security/user?pretty" )

    if [[ -n "${ELASTIC_PASSWORD:-}" ]]; then
        args+=( '-u' "elastic:${ELASTIC_PASSWORD}" )
    fi

    local -i result=1

    local line
    local -i exit_code
    local -i num_users

    # retry for max 30s (30*1s)
    for _ in $(seq 1 30); do
        num_users=0

        # read exits with a non-zero code if the last read input doesn't end
        # with a newline character. The printf without newline that follows the
        # curl command ensures that the final input not only contains curl's
        # exit code, but causes read to fail so we can capture the return value.
        # Ref. https://unix.stackexchange.com/a/176703/152409
        while IFS= read -r line || ! exit_code="$line"; do
            if [[ "$line" =~ _reserved.+true ]]; then
                (( num_users++ ))
            fi
        done < <(curl "${args[@]}"; printf '%s' "$?")

        if ((exit_code)); then
            result=$exit_code
        fi

        # we expect more than just the 'elastic' user in the result
        if (( num_users > 1 )); then
            result=0
            break
        fi

        sleep 1
    done

    return $result
}

# Verify that the given Elasticsearch user exists.
function check_user_exists {
    local username=$1

    local elasticsearch_host="${ELASTICSEARCH_HOST:-elasticsearch}"

    local -a args=( '-s' '-D-' '-m15' '-w' '%{http_code}'
        "http://${elasticsearch_host}:9200/_security/user/${username}"
        )

    if [[ -n "${ELASTIC_PASSWORD:-}" ]]; then
        args+=( '-u' "elastic:${ELASTIC_PASSWORD}" )
    fi

    local -i result=1
    local -i exists=0
    local output

    output="$(curl "${args[@]}")"
    if [[ "${output: -3}" -eq 200 || "${output: -3}" -eq 404 ]]; then
        result=0
    fi
    if [[ "${output: -3}" -eq 200 ]]; then
        exists=1
    fi

    if ((result)); then
        echo -e "\n${output::-3}"
    else
        echo "$exists"
    fi

    return $result
}

# Set password of a given Elasticsearch user.
function set_user_password {
    local username=$1
    local password=$2

    local elasticsearch_host="${ELASTICSEARCH_HOST:-elasticsearch}"

    local -a args=( '-s' '-D-' '-m15' '-w' '%{http_code}'
        "http://${elasticsearch_host}:9200/_security/user/${username}/_password"
        '-X' 'POST'
        '-H' 'Content-Type: application/json'
        '-d' "{\"password\" : \"${password}\"}"
        )

    if [[ -n "${ELASTIC_PASSWORD:-}" ]]; then
        args+=( '-u' "elastic:${ELASTIC_PASSWORD}" )
    fi

    local -i result=1
    local output

    output="$(curl "${args[@]}")"
    if [[ "${output: -3}" -eq 200 ]]; then
        result=0
    fi

    if ((result)); then
        echo -e "\n${output::-3}\n"
    fi

    return $result
}

# Create the given Elasticsearch user.
function create_user {
    local username=$1
    local password=$2
    local role=$3

    local elasticsearch_host="${ELASTICSEARCH_HOST:-elasticsearch}"

    local -a args=( '-s' '-D-' '-m15' '-w' '%{http_code}'
        "http://${elasticsearch_host}:9200/_security/user/${username}"
        '-X' 'POST'
        '-H' 'Content-Type: application/json'
        '-d' "{\"password\":\"${password}\",\"roles\":[\"${role}\"]}"
        )

    if [[ -n "${ELASTIC_PASSWORD:-}" ]]; then
        args+=( '-u' "elastic:${ELASTIC_PASSWORD}" )
    fi

    local -i result=1
    local output

    output="$(curl "${args[@]}")"
    if [[ "${output: -3}" -eq 200 ]]; then
        result=0
    fi

    if ((result)); then
        echo -e "\n${output::-3}\n"
    fi

    return $result
}

# Ensure that the given Elasticsearch role is up-to-date, create it if required.
function ensure_role {
    local name=$1
    local body=$2

    local elasticsearch_host="${ELASTICSEARCH_HOST:-elasticsearch}"

    local -a args=( '-s' '-D-' '-m15' '-w' '%{http_code}'
        "http://${elasticsearch_host}:9200/_security/role/${name}"
        '-X' 'POST'
        '-H' 'Content-Type: application/json'
        '-d' "$body"
        )

    if [[ -n "${ELASTIC_PASSWORD:-}" ]]; then
        args+=( '-u' "elastic:${ELASTIC_PASSWORD}" )
    fi

    local -i result=1
    local output

    output="$(curl "${args[@]}")"
    if [[ "${output: -3}" -eq 200 ]]; then
        result=0
    fi

    if ((result)); then
        echo -e "\n${output::-3}\n"
    fi

    return $result
}
Dockerfile
ARG ELASTIC_VERSION

# https://www.docker.elastic.co/
FROM docker.elastic.co/elasticsearch/elasticsearch:${ELASTIC_VERSION}

USER root

RUN set -eux; \
    mkdir /state; \
    chmod 0775 /state; \
    chown elasticsearch:root /state

USER elasticsearch:root

ENTRYPOINT ["/entrypoint.sh"]
logstash_writer.json
{
  "cluster": [
    "manage_index_templates",
    "monitor",
    "manage_ilm"
  ],
  "indices": [
    {
      "names": [
        "logs-generic-default",
        "logstash-*",
        "ecs-logstash-*"
      ],
      "privileges": [
        "write",
        "create",
        "create_index",
        "manage",
        "manage_ilm"
      ]
    },
    {
      "names": [
        "logstash",
        "ecs-logstash"
      ],
      "privileges": [
        "write",
        "manage"
      ]
    }
  ]
}
.env
ELASTIC_VERSION=8.6.2

## Passwords for stack users
#

# User 'elastic' (built-in)
#
# Superuser role, full access to cluster management and data indices.
# https://www.elastic.co/guide/en/elasticsearch/reference/current/built-in-users.html
ELASTIC_PASSWORD='changeme'

# User 'logstash_internal' (custom)
#
# The user Logstash uses to connect and send data to Elasticsearch.
# https://www.elastic.co/guide/en/logstash/current/ls-security.html
LOGSTASH_INTERNAL_PASSWORD='changeme'

# User 'kibana_system' (built-in)
#
# The user Kibana uses to connect and communicate with Elasticsearch.
# https://www.elastic.co/guide/en/elasticsearch/reference/current/built-in-users.html
KIBANA_SYSTEM_PASSWORD='changeme'

## Add more passwords if needed for additional modules like beats etc.
Initial Setup
Once the directory and files are setup, run:
docker compose up -d
docker-compose up -d
The "changeme" password set by default for all aforementioned users is unsecure. For increased security, we will reset the passwords of all aforementioned Elasticsearch users to random secrets.
1. Reset passwords for default users
The commands below reset the passwords of the elastic, logstash_internal and kibana_system users. Take note of them.
docker compose exec elasticsearch bin/elasticsearch-reset-password --batch --user elastic
docker-compose exec elasticsearch bin/elasticsearch-reset-password --batch --user logstash_internal
docker-compose exec elasticsearch bin/elasticsearch-reset-password --batch --user kibana_system
-
Replace usernames and passwords in configuration files
Replace the passwords generated in the .env file. -
Restart Logstash and Kibana to re-connect to Elasticsearch using the new passwords
docker compose up -d logstash kibana
Note: Before making your elk stack live on a server, read more about how to Secure the Elastic Stack.
You can now relaunch kibana by opening http://localhost:5601/ and entering your new generated password.

Enter elastic as username and your generated password.
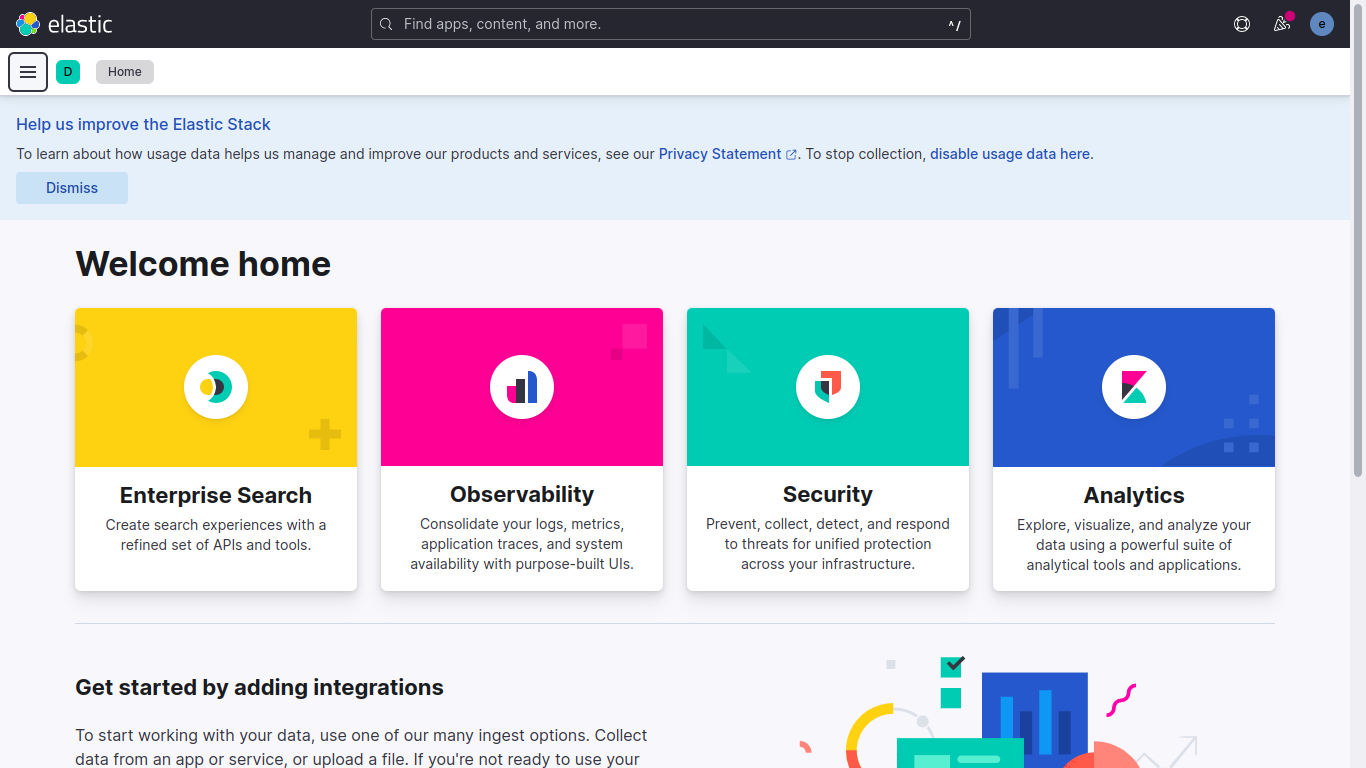
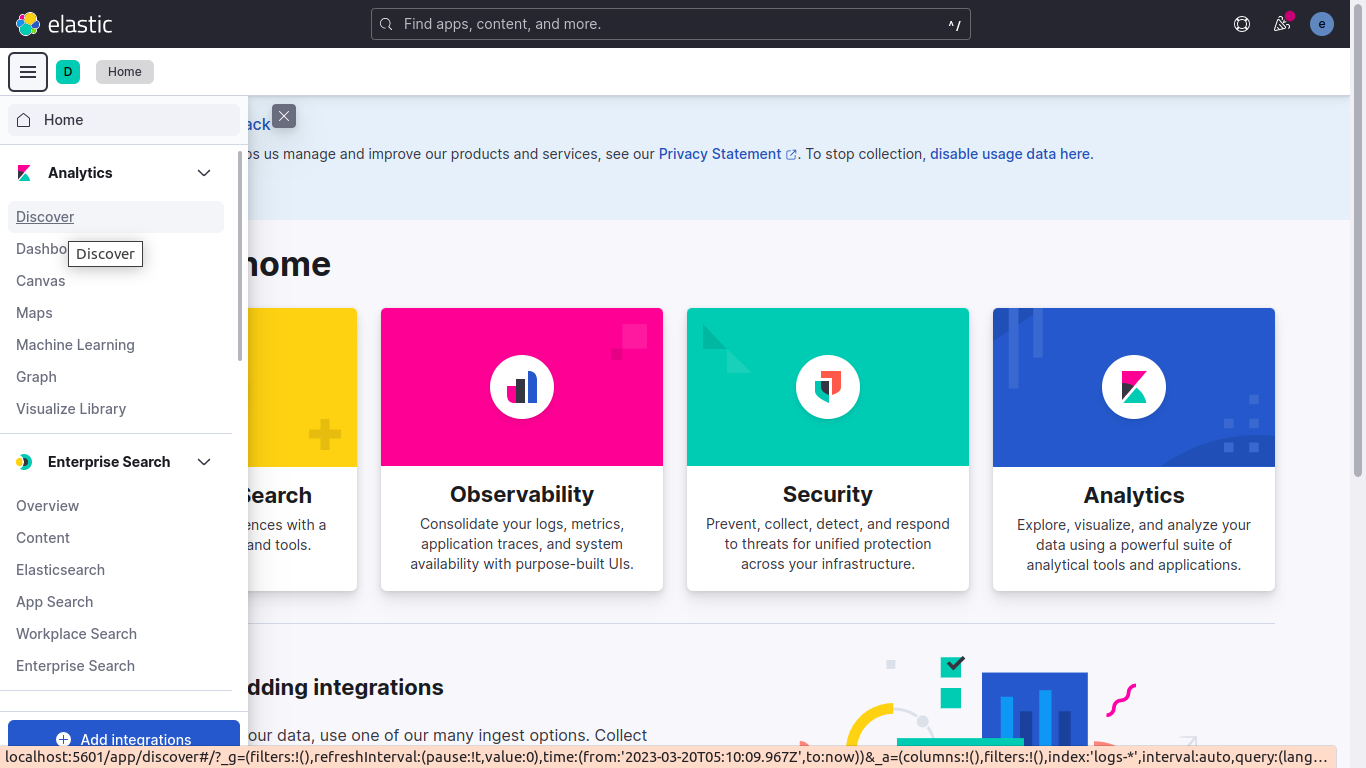
Go to the "discover" in the left pane.
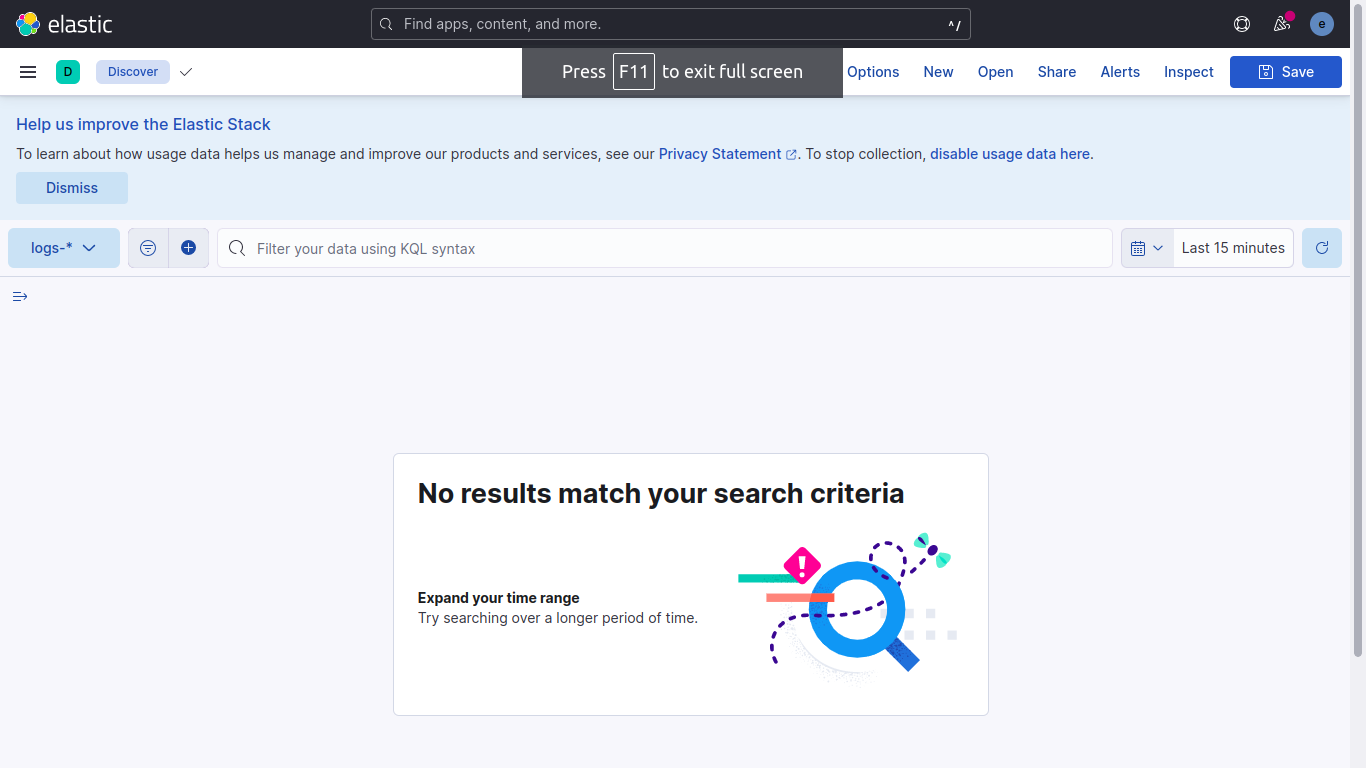
As we can see, we do not have any logs in elasticsearch.
Going back to logstash.conf, we see that we are using the tcp codec for input. This means we need to post our log to tcp port 50000. We can do so by simply posting our generated log to the container's port 50000.
For now, to populate our data, we will post a .log file to it.
# Execute `nc -h` to determine your `nc` version

cat /path/to/logfile.log | nc -q0 localhost 50000          # BSD
cat /path/to/logfile.log | nc -c localhost 50000           # GNU
cat /path/to/logfile.log | nc --send-only localhost 50000  # nmap
Now that the logs have been loaded to elasticsearch through logstash, refresh the discover page on kibana.
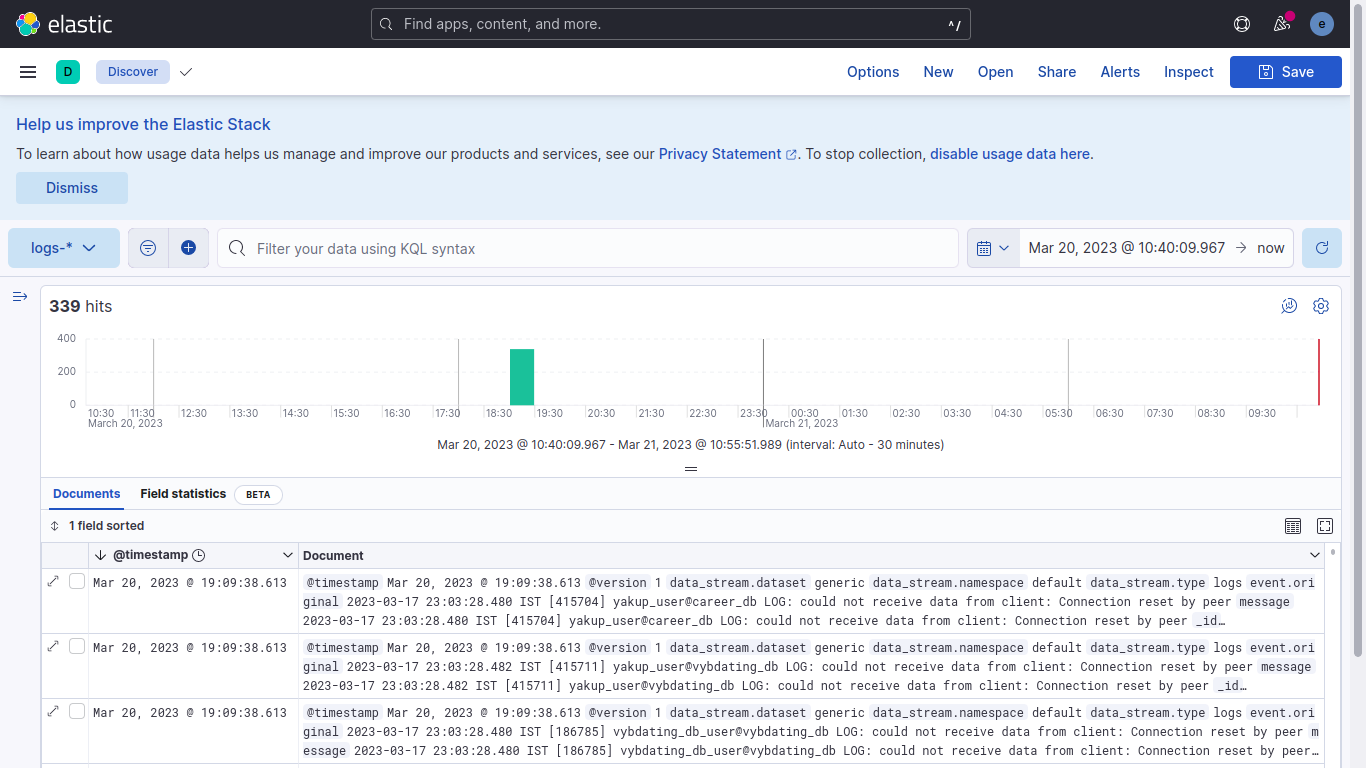
Further configurations
We can further configure elasticsearch, kibana and logstash by adding more configuration in their respective .yml files that we already made above.