Optimizing Application and Improving Performance in React
Table of Content
- **Introduction
. Overview of React app optimization . Benefits of optimizing React app code . Common performance issues in React apps
- **Profiling React Apps
. Using the React Profiler to identify performance issues . Analyzing data from the React Profiler . Making targeted optimizations based on profiler data
- **Code Optimization Techniques
. Memorization with React.Memo() . Reducing component re-renders with shouldComponentUpdate() . Optimizing event handlers with useCallback() . Using the useMemo() hook for memorizing values . Lazy loading with React.lazy() and Suspense . Code splitting with webpack
- **Rendering Performance
. Avoiding index as keys . Improving rendering performance with the React Context API
- **Network Performance
. Using code splitting to reduce initial load time . Minimizing network requests with server-side rendering (SSR)
Introduction
Before optimizing a React application, we must understand how React updates its UI and how to measure an app’s performance.This makes it easy to solve any React performance problems. Let’s start by reviewing how the React UI updates.
When we create a rendered component, React creates a virtual DOM for its element tree in the component. Now, whenever the state of the component changes, React recreates the virtual DOM tree and compares the result with the previous render.
It will only update the changed element in the actual DOM through diffing.
Overview of React app optimization
React app optimization involves improving the performance of your React application by reducing its load time,minimizing its memory usage, and making it more responsive.Optimization can help ensure that your application runs smoothly and efficiently, even as it grows in complexity and user traffic
Benefits of optimizing React app code
. Improved performance: By optimizing your code, you can reduce the time it takes for your app to load and respond to user interactions, . leading to a better user experience. This can include things like optimizing component rendering, reducing the size of your app's JavaScript bundle, and minimizing unnecessary network requests.
. Reduced costs: A faster, more performant app can reduce your hosting costs, as you'll need fewer resources to handle the same amount of traffic. Additionally, by optimizing your code, you may be able to reduce the amount of time and resources you need to spend on maintenance and debugging.
. Better user engagement: A faster, more responsive app can improve user engagement and satisfaction, leading to better retention and conversion rates.
. Improved SEO: Search engines like Google consider page load times as a ranking factor. By optimizing your app's code and reducing its load time, you can improve its search engine rankings and attract more organic traffic.
. Easier to maintain: By optimizing your code, you can make it more modular and easier to maintain over time. This can include things like refactoring complex components into simpler ones, reducing the number of dependencies your app relies on, and using best practices like code splitting and lazy loading.
Common performance issues in React apps
There are several common performance issues that can arise in React apps, including:
. Unnecessary re-renders: React's reactivity model means that changes to any part of the app's state can trigger a re-render of the entire component tree. If your components are unnecessarily re-rendering, it can slow down your app and reduce its performance.
. Large component trees: As your app grows in complexity, it's easy to end up with deeply nested component trees that can be slow to render and update. This can be exacerbated by unnecessary re-renders and other performance issues.
. Inefficient data fetching: If your app needs to fetch data from an API or other external source, inefficient data fetching can lead to slow page load times and reduced user engagement.
. Bloated JavaScript bundles: Large JavaScript bundles can take a long time to download and parse, slowing down your app's load time and increasing its memory usage.
. Memory leaks: If your app has memory leaks, it can cause your app to slow down or crash over time.
. Improper use of state: Improper use of state, such as using setState() in a loop or rendering a large number of elements, can cause performance issues in your app.
. Unoptimized images: Large or unoptimized images can slow down your app's load time and increase its memory usage.
To address these performance issues, you can use tools like React Profiler, Chrome DevTools, and Lighthouse to identify and diagnose performance bottlenecks in your app. Additionally, you can use best practices like code splitting, lazy loading, and caching to optimize your app's performance and improve its user experience.
Profiling React App
Profiling React apps involves measuring the performance of your application in order to identify performance bottlenecks, optimize the application and ensure a smooth user experience. Profiling is important because as your React application grows in complexity, it can become slower and less responsive, leading to a poor user experience. Profiling your React app can help you identify which parts of your app are causing performance issues, allowing you to optimize them and improve overall performance.
There are several tools available to profile React apps, including the built-in Chrome DevTools Performance tab, React DevTools Profiler, and other third-party tools like the Performance Timeline API, Flamegraphs, and CPU profilers.
Profiling in React can be done using various tools and libraries.
Here are some steps to add profiling in a React app using the built-in React DevTools Profiler:
Install React DevTools: The React DevTools is a browser extension that allows you to Inspect and profile React components. You can install it from the Chrome Web Store or Firefox Add-ons.
Import React Profiler: In your React app, import the Profiler component from the react library.
``` import React, { Profiler } from 'react';
```
Wrap components with the Profiler component: Wrap the components you want to profile with the Profiler component, and give it an id and onRender prop.
The id prop is a unique identifier for the component being profiled, and the onRender prop is a function that is called every time the component is rendered. You can use the onRender function to log data or send it to a third-party tool for analysis.
Define the onRender callback function: Define the onRender function that will be called by the Profiler component. This function will receive three arguments: id, phase, and actualDuration.
const callback = (id, phase, actualDuration) => {
console.log(${id} took ${actualDuration} ms to render);
};
In this example, the onRender function logs the time taken to render the component.
Open React DevTools: Open the React DevTools extension in your browser and select the "Profiler" tab.Here you will be able to see a visualization of your component's performance data.
Analyze the data: Use the data in the DevTools Profiler to identify areas of your app that may be causing performance issues, and optimize your code accordingly.
Analyzing data from the React Profiler
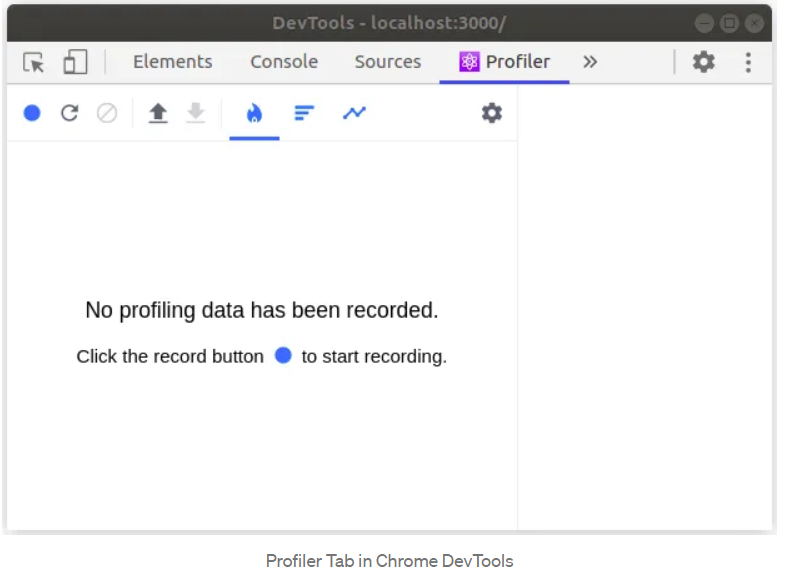
If your application supports React Profiler, you can see the above initial screen in DevTools under the ⚛ Profiler tab. We'll be looking at two main topics.
Performance Profiling a React application
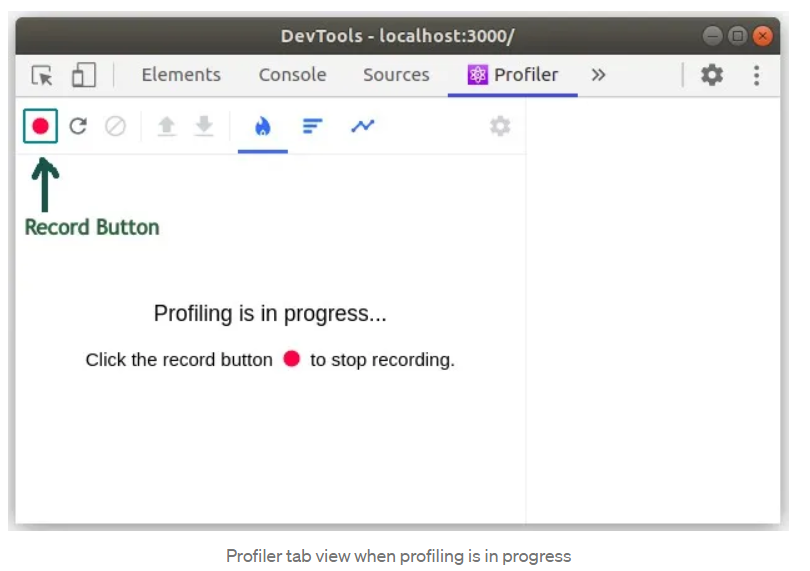
Profiling a React application is very easy. It involves only 3 steps.
. Click the Record button in the Profiler tab
. Use your application as you usually would. (The Profiler will gather information about application re-renders at this stage)
. Click the Record button again to finish recording (You may also have a separate Stop button to finish recording based on the browser you use).
### Making targeted optimizations based on profiler data
Usually, React works in two phases: the render phase and the commit phase.
-
Flame Chart
-
Ranked Chart
-
Interaction Chart
-
Component Chart
Here are some steps you can follow to make targeted optimizations based on profiler data:
. Collect profiling data: Use a profiling tool to measure the performance of your code. There are many profiling tools available for different programming languages, such as PyCharm, Visual Studio, Xcode, and many others.
. Analyze the profiling data: Look at the profiling data to identify the areas of your code that are using the most resources or taking the most time to execute. This could include functions or loops that are being called repeatedly or inefficiently, or memory-intensive operations that could be optimized.
. Prioritize optimizations: Based on the analysis of the profiling data, prioritize the optimizations that are most likely to have the biggest impact on performance. Focus on the areas that are using the most resources or taking the most time to execute.
. Make targeted optimizations: Once you have identified the areas to optimize, use targeted optimizations to improve their performance. This could include refactoring code to eliminate unnecessary operations, optimizing algorithms,or using more efficient data structures.
. Test and verify: After making optimizations, test and verify that they have improved performance. Use the profiling tool to measure the performance of the optimized code and compare it to the original profiling data. If the optimizations have been successful, you should see a noticeable improvement in performance.
. Iterate: If necessary, repeat the process by collecting new profiling data and analyzing it to identify further areas for optimization.
Code Optimization Techniques
Memorization with React.Memo()
Memoization is a programming technique used to improve the performance of functions by caching the results of expensive function calls and returning the cached result when the same inputs occur again.
In JavaScript, memoization can be implemented by creating a higher-order function that takes in the original function and returns a new function that caches the results of the original function. Here's an example:
function memoize(func) { const cache = {}; return function(...args) { const key = JSON.stringify(args); if (key in cache) { return cache[key]; } else { const result = func.apply(this, args); cache[key] = result; return result; } }; }
function expensiveOperation(x, y) { console.log('Executing expensiveOperation...'); return x * y; }
const memoizedOperation = memoize(expensiveOperation);
console.log(memoizedOperation(2, 3)); // Output: Executing expensiveOperation... 6 console.log(memoizedOperation(2, 3)); // Output: 6 (cached)
Using the useMemo() hook for memorizing values
useMemo is a built-in hook in React that allows you to memorize the results of a function and recompute the results only when the dependencies of the function change. This can help optimize the performance of your application by avoiding unnecessary re-renders.
Here's an example of using useMemo:
import React, { useState, useMemo } from 'react';
function App() { const [num1, setNum1] = useState(0); const [num2, setNum2] = useState(0);
const sum = useMemo(() => { console.log('Computing sum...'); return num1 + num2; }, [num1, num2]);
return (
Sum: {sum}
To achieve this, we use useMemo to memoize the function that computes the sum. The first argument to useMemo is the function that computes the sum, and the second argument is an array of dependencies that tells React when to recompute the sum. In this case, the dependencies are num1 and num2.
When the user changes the value of num1 or num2, React will recompute the sum only if the new values of num1 or num2 are different from their previous values. If the values haven't changed, React will return the cached result of the previous computation.
Optimizing event handlers with useCallback()
useCallback is a built-in hook in React that allows you to memoize a function and re-create the function only when its dependencies change.This can help optimize the performance of your application by avoiding unnecessary re-renders.
Here's an example of using useCallback:
import React, { useState, useCallback } from 'react';
function App() { const [count, setCount] = useState(0);
const increment = useCallback(() => { setCount(prevCount => prevCount + 1); }, []);
return (
Count: {count}
In this example, we have a button that, when clicked, increments a count. We want to use useCallback to memorize the increment function so that it only gets re-created when the setCount function changes.
The first argument to useCallback is the function to memoize, and the second argument is an array of dependencies that tells React when to re-create the function. In this case, we don't have any dependencies, so we pass an empty array [].
When the user clicks the button, the increment function is called, which in turn calls the setCount function to update the count. Because we've memoized the increment function using useCallback, React will only re-create the function if the setCount function changes. Otherwise, it will return the cached function from the previous render.
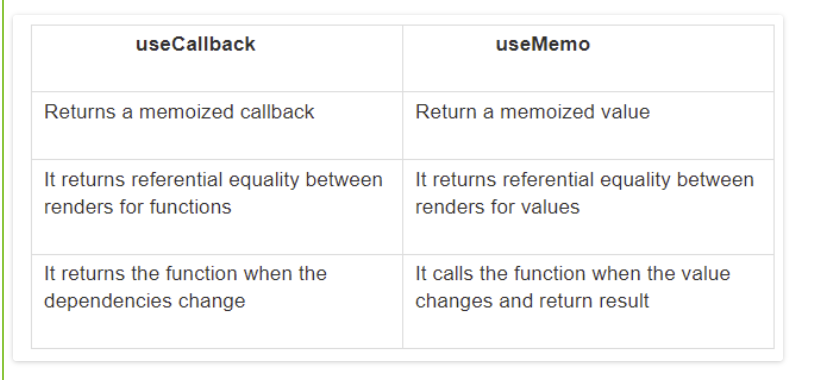
Difference between UseCallback and UseMemo
Reducing component re-renders with shouldComponentUpdate()
shouldComponentUpdate() is a lifecycle method in React that allows you to control whether a component should re-render or not. By default, a component will re-render whenever its state or props change, but you can use shouldComponentUpdate() to optimize performance by preventing unnecessary re-renders.
Here's an example of using shouldComponentUpdate() to prevent a component from re-rendering unnecessarily:
class MyComponent extends Component { shouldComponentUpdate(nextProps, nextState) { if (this.props.name === nextProps.name && this.state.count === nextState.count) { return false; } return true; }
render() { return (
Name: {this.props.name}
Count: {this.state.count}
Lazy loading with React.lazy() and Suspense
Lazy Loading
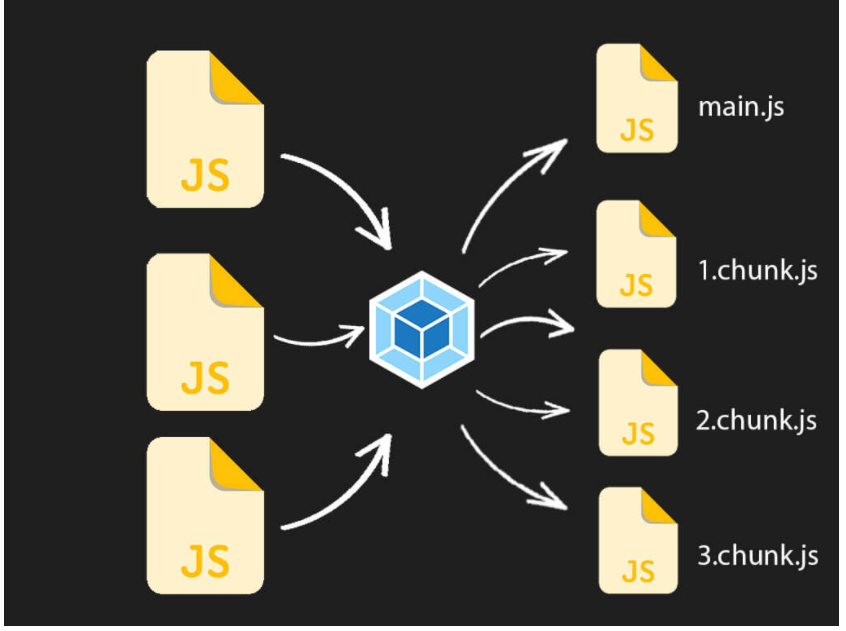
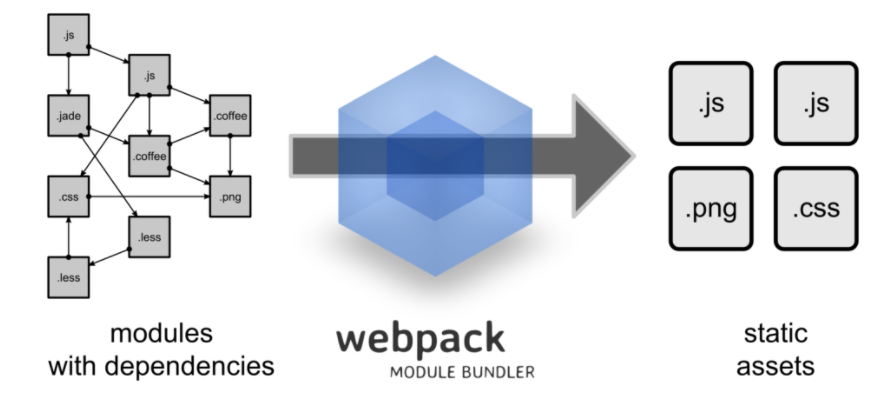
Lazy loading, also known as code splitting, is a technique used in React to improve the performance of your application by loading only the necessary code at the time of rendering. It allows you to split your code into smaller chunks and load them on demand, rather than loading all the code at once.
In a typical React application, all the components are bundled together in a single file, which can be quite large. When the user navigates to a page, the entire bundle is loaded, including components that may not be needed right away. This can slow down the initial load time of your application and cause unnecessary delays.
With lazy loading, you can split your code into smaller chunks and load only the code that is needed for a particular page or component. For example, if your application has a dashboard page and a settings page, you can split the code for each page into separate bundles and load them on demand, as needed.
Here's an example of using lazy loading in React:
import React, { Component } from 'react';
import React, { lazy, Suspense } from 'react';
const Dashboard = lazy(() => import('./Dashboard')); const Settings = lazy(() => import('./Settings'));
function App() { return (
